
We will provide you with a comprehensive assignment sample demonstrating analytics’s transformative power in operations and logistics management, showcasing how data-driven insights can unlock new opportunities for operational excellence and competitive advantage.
Table of Contents
Introduction
Power Bi features
Identification of the concepts of the Fact and Dimension table’s relationship
An explanation and analysis of the KPIs in the Dashboard design showing the intelligence applications for the organisations’ continuous performance improvement
The proposed benefits that the new system can realize
Conclusion
Reflective section by using Gibb’s reflective framework
Reference
Introduction
Over time, the business organization has faced a lot of changes, and now, in the modern world, companies are focusing on technological development. The developments in the technological field are providing exciting and effective features to the business, enhancing the daily performance of the business organization. In the UK market, the business organizations currently leading the market are applying changes in the regular functions and operations for better productivity and control over the business (Abbott, 2013). In the new world, to survive the market competition and balance the supply and demand chain in the industry, every organization should focus on implementing better technology in the communication and IT sectors. In this report, a thorough investigation of the technological and communication changes in the business organization will be highlighted per the organizational context of Logi Service, which has been supplying the necessary materials to the SME organization. This organization has been doing business for a long time and has managed to grow properly. The business’s authority invests huge capital for proper information and communication development. For this development process, this report will help them to decide the proper channels and modern technological developments to enhance their control over the business.
Power Bi features
Power Bi software has been introduced in the market for better visualization features that can be used for business purposes. More prominent companies are always playing with numerical data. They have to take effective decisions based on analysing the previous data like sales, market segment, etc. This software has allowed the business organisation to make the data adequately sorted out and easily understood by the authority and management. This software currently offers many features, and in this part of the report, some of the major features of this software are explained as follows.
Data Source: Google Sheet
Interface: The interface of Power Bi is very well designed and focused on being easy to use and understand. With little knowledge, the business organization can import their previous data and sort them out for better understanding. The interface of this software is designed so that a particular business organization can publish their data, and share the data with the other communication channel of it (Jaksa & Pritchard, 2020). This provides the facility to view the data on the cloud system and the management of Logi Service has applied this software for these special features. As the operations of this organization are getting bigger, they have to share the data with the management and other channels to take a productive decision. This software provides this feature very effectively.
Data Source: Google Sheet
Workflow: The workflow of Power Bi is also simple and easy to understand. The basic workflow allows Logi Service to import their data and organize them to provide better visualization of them. This type of visualization is very effective in investor meetings because they can easily understand the overall market scenario, sales, and customers through the visualization. They do not have to calculate the data like in the old time (Lefebvre & Lefebvre, 2018). Some simple steps can describe this workflow. First Logi Service has to import their spreadsheet to Power Bi, and then they have to choose which data of spreadsheet they want to display to the authorized partners. Then there are many templates which can be used to design the dashboards. The dashboards can organize many pages of numerical data into a single page and with a better understanding facility.
Data Source: Google Sheet
Query environment
This is the feature of Power Bi which is used for arranging the data according to the need. In the query environment, the data can be arranged as per the need of the visualization. The column and row of the spreadsheet can be connected or disconnected in the edit category of the query environment. This allows editing the data and arranging them repeatedly over the cloud. Logi Service can feature its data reports in the Power Bi cloud system (Niosi et al., 2016). This data and dashboards can be accessed from anywhere and in times of need, the query environment allows them to connect more than one column or row to the existing ones for better results.
Identification of the concepts of the Fact and Dimension table’s relationship
Concept of fact
A spreadsheet which contains the organization’s previous numerical data and that can be used for visualization in Power Bi software, can be defined as a fact table. The fact table contains all the numerical information about the company. The company can use these data to make a visualization on which basis, the decision will be taken. The fact table can also contain foreign keys. But the data must be numerical (Tan, 2016). For instance, it can be said that Logi Service has many spreadsheet data for their sales report, customer segments, employee performances, supply and demand, product category, etc. These are all examples of fact tables.
Dimension table
When a spreadsheet contains information other than numerical ones, then it can be defined as a dimension table. More prominent companies record and store data as per their details with them. For example, it can be said that a spreadsheet can have data on the total sales details. In this report, the product category, product name, store address, and name can also be stored. These are all descriptive data. These types of non-numerical data can be stored in the dimension tables.
For Power Bi or any other visualization software, fact table and dimension table play a great role. Separating them to get a better view of the data in the visualization process is very necessary. Logi Service has recorded all their data in a mixed method, and by using Power Bi, they can always edit the data and separate the fact table and dimension tables (2002). They can also arrange them together as per their need. For a real scenario, if Logi Service wants to visualise its sales data, it can apply Power Bi to arrange the product category based on sales records. It can also show which location has the highest sales in which months. The use of fact tables and dimension tables provides this facility to Logi Service and any other business organization that uses this kind of software.
An explanation and analysis of the KPIs in the Dashboard design showing the intelligence applications for the organisations’ continuous performance improvement
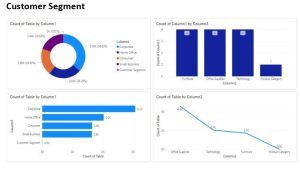
Customer segment
The dashboard designed for Logi Service has a customer segment visualized. The dashboard shows that the customer segment has been arranged so that the management or the authority can easily understand the customer from different locations and how they react to the different product categories (Dodgson, 2020). The dashboard also represents the current status of customer engagement for different sub-category products. This single dashboard can represent all the necessary information for Logi Service, and the company’s management can use this dashboard for decisions and future development.
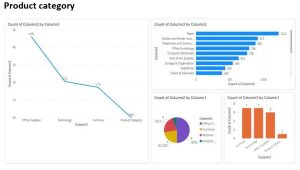
Product category
Another dashboard is designed for product category information. This dashboard represents the information according to the product category, product subcategory and how these are performing in the real market (Oyelaran-Oyeyinka, 2016). The company management can easily identify the product and supply chain operations performances by the product category dashboard. This allows the authority of Logi Service to take effective decisions related to product development in the future. They can identify the newly launched product performances and make better planning for future production as well.
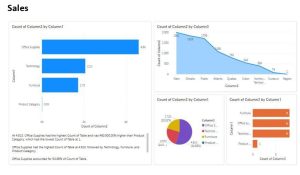
Sales
For Logi Service, a sales dashboard has also been designed in the report. This dashboard arranges the numerical and descriptive data of Logi Service in order so that the management can find all the necessary information about the sales department on a single page. The dashboard is representing the sales trend of different product categories. In which location how many sales are made in which months (Wilson, 2019). All the necessary information about the sales is displayed in the dashboard. By the total sales value and different product sales trends, Logi Service can easily find out the gaps in the business and this way they can apply better improvement planning for the future.
The proposed benefits that the new system can realize
Power Bi is offering some benefits to a big organization like Logi Service. Some of the major benefits of this software are explained as follows.
Rich personalize dashboard
The dashboards can be arranged as per the need of the company. Power Bi offers many personalisation features. By using these; one can design his dashboard according to his need and taste. This has made it much easier for the company to make their type of report and use them in the proper sector (Abbott, 2013). The personalized dashboard can have a personal touch which makes the dashboard more appealing and easy to understand. This serves as the main benefit of the software. Logi Service can use this benefit to make their dashboards to attract investors and make an effective plan for the future.
Secure report publishing
Power Bi has a feature to publish the reports into their server. This offers the benefit that a company can publish their report and its authorized parties can find that in the Power Bi server. This way the company can make a better hold in the industry as all the other companies can find their information and know their position in the current market (Jaksa & Pritchard, 2020). The authorized party can also see the report and this way the communication channels are utilized very well for the company. This benefit can enhance the communication performance of Logi Service.
Fast workflow
The workflow which Power Bi has offered is very fast and easy. Anyone with basic knowledge of this software can easily import the data and visualise them simply and effectively. This fast workflow feature is providing extra benefit to the organization because they can make instant changes in the data and they can also make the data visualized in a very fast process (Lefebvre & Lefebvre, 2018). It reduces work time and enhances the company’s performance in a wider organizational context.
Balanced simplicity and performances
The performance of Power Bi is very simple and easy to get. It has been designed so that the companies can arrange their extensive numerical and descriptive data on a single page. With some basic and simple features and work processes, this software can achieve more extensive performances. Logi Service can use this benefit as they are handling large operations and functions in the current times. So they need to use this software to get better performances with less time consumed.
Collaborating with another functional unit of the business
Power Bi can merge different functional units of a business organization. As it connects the numerical data with the descriptive ones, the data of different functional units can be arranged as per the company’s need (Lefebvre & Lefebvre, 2018). For example, it can be said that the sales department wants to see the relation of the recent marketing plan on new products. The feature of Power Bi can be used for making a dashboard that can connect the marketing department and sales information on a single page.
No special technical support required
Another benefit of Power Bi is that it does not require any special technical support to be used for business purposes. This a software of Microsoft and they are providing updates with the latest features from time to time. The maintenance of this special software is also very easy. The authorized person can update the software with some simple steps and the company can use them for different purposes (Niosi et al., 2016). In addition, the work process of this software is also easy. So if Logi Service applied this software in the organization, they will not need any special technical support to maintain it.
Integrating seamlessly with existing technology
One of the significant benefits of this software is that it can be used seamlessly with the existing technology in the business sector. Usually, all kind of business organization uses data spreadsheet the record the data. Power Bi is well-cooperated with a spreadsheet. So there is no problem or issues in using this software with the existing technology or software in the organization. In addition, this is a very lightweight software and it does not require any special specifications of computers to be used (Tan, 2016). So Logi Service can easily implement this software in their operations.
Conclusion
The current world is advancing very fast and the business industry is also getting these changes quickly. To survive in the competition of organizations, every business should focus on implementing modern developments because without adopting modern developments, there will be no chance of existing in the current competition. This report has shown how a medium-scale organization named Logi Service can apply changes in the technology sector and how their operations can be improved. This report will help them to have better-controlling power over the regular operations and achieve the wider organizational objectives.
Reflective section by using Gibb’s reflective framework
Description
A business organization which supplies products to SME organizations named Logi Service has a situation where the management of this company is spending huge capital on technological development. They want to enhance the company’s performance by applying changes in the operation and functions based on communication and information technology (Green, 2002). In this situation, the employees accept the changes but must have proper training and motivation to use these technological changes better. The management of Logi Service has recruited me to handle this situation. I have to make a plan so that the employees and the organisation’s management can be balanced and the new changes can be adopted in the broader organizational contexts better.
Feelings
When applying the changes, the employees faced many problems regarding the use and application. Proper training and motivation sessions had to be arranged to solve this situation. In the journey with the employees, it has been seen that they want to learn and adopt new changes as those enhance the work process and reduce the hard work (Oyelaran-Oyeyinka, 2016). The traditional process was very time-consuming and now employees are getting that benefit. The whole journey was good with Logi Service as they supported arranging necessary programs at different times.
Evaluation
In the whole journey, Logi Service has provided all the necessary support for the change program but there were some negative points which need to be mentioned as well. There was a very less duration for the whole program. Managing the whole project within the proper time frame was very challenging. The employees were also forced to keep their regular roles and responsibilities and the change program training session (Stephens, 2017). A longer period frame would make this easier for me and the employees.
Conclusion
The journey with Logi Service was very stable and balanced for me. I got to learn some new things which can enhance my future performance. The whole journey was focused on technological developments in business organizations. This learning will help me to get involved in these types of programs in the future with better productivity. Besides these, some additional skills would help me better control the teams.
Action
Some project planning courses can be enrolled in the online sector to gain skills in project planning within a short period. This way my project planning skill will be developed, and I can plan big projects quickly.
Reference
Commerce business development in Jamaica: A portal to the new economy (2002). New York: United Nations.
Dodgson, M. (2020) Technological collaboration in industry: Strategy, policy, and Internationalization in Innovation. London: Routledge.
Oyelaran-Oyeyinka, B. (2016) Learning to compete in African Industry: Institutions and Technology in development. Aldershot, Hants, England: Ashgate.
Stephens, A. (2017) Public library collection development in the information age. New York: Haworth Press.
Wilson, G.W. (2019) Technological Development and economic growth. Bloomington: Published by the School of Business, Division of Research, Indiana University.
Abbott, L.F. (2013) Technological Development in industry: A business-economic survey and analysis. Manchester, England: Industrial Systems Research.
Jaksa, J.A. and Pritchard, M.S. (2020) Responsible communication: Ethical issues in business, industry, and the Professions. Cresskill, NJ: Hampton Press.
Lefebvre, L.A. and Lefebvre, E. (2018) Management of Technology and Regional Development in a global environment: An international perspective. London: P. Chapman.
Niosi, J. et al. (2016) Flexible innovation: Technological alliances in Canadian industry. Montreal: McGill-Queen’s University Press.
Tan, T.M. (2016) Business opportunities in India. Singapore: Prentice Hall.