Table of Contents
Introduction
Evaluating two recent developments in the international financial environment which has impacted Starbucks Coffee
Multinational Enterprise’s international financial or risk management strategy
Analyzing financial performance
Conclusion
References
Appendix
Introduction
Currently, the world is moving very fast and business activities have been raised a great number due to globalization and other supporting factors. In the race or competition of business, political, and economic factors, finance has been a significant part of the whole journey. In the modern world, business organizations have to look deeper at financial activities when setting up or expanding business across the border (Brighouse & Hontoir, 2015). International finance can be defined as the complex finance activities between different countries or across the border. In the international financial environment, different financial activities are being targeted like trade, investment, currency exchange, capital movement, etc. After the development of globalization, the international financial environment has played a significant role in professionally managing finance and business. To participate in the international market for business or trade, it is now very important to have a deep understanding of the international financial environment because this is related to every step of economic activities across the border. Political stability, economic growth, developments, etc. play a role in regularly shaping the international financial market (Gabriel, 2013). In the international financial environment, business organisations are often impacted by different development. This report wants to portray some situations of a famous Starbucks coffee business organisation regarding the international financial environment. This organization sells coffee and snacks item since the beginning and they have been very famous in the coffee industry worldwide. Currently, they are running business in more than 70 countries in the world. This company has managed to gain net income of 2.3 million in 2021 and 2.9 million in the year of 2022 as per their annual report (Starbucks, 2022) and currently rulling this industry among many other companies. The report will discuss how recent developments in the international financial environment have impacted this international coffee chain in different ways. In addition, the risk management strategy for this company along with an analysis of financial condition as per the previous annual reports will be presented as well in this report.
Section A
Evaluating two recent developments in the international financial environment which has impacted Starbucks Coffee
There has been different kind of recent developments in the international financial environment which are impacting Starbucks Coffee. In this part of the report, as per the recent two development in the international financial environment and their impacts on Starbucks Coffee will be explained as follows.
1.1 Development One:Foreign exchange rate fluctuation
As it is known that Starbucks Coffee has been operating business in many countries as an international chain coffee shop. In this matter, the fluctuating foreign exchange rate can be a bigger matter for this company. Starbucks Coffee is operating a business in many countries with different currencies. So if one country is facing inflation and as per the dollar rate, the country’s currency rate is decreased, then Starbucks Coffee will have to face great consequences for it (Gentile et al., 2016). For instance, it can be said that recently in the Asia sector, the currency rate has decreased as per the dollar rate. So it can be said that if Starbucks Coffee brings back the profit to the US they will be facing a business boost or profit boost within a short time. This way the business organization can be very beneficial for financial development in the international financial environment (Gonzalez, 2017). On the contrary, if the currency rate is increased as per the dollar rate, then Starbucks Coffee will have to face a good amount of loss when they will bring the money to the US. This way, fluctuating foreign exchange rates can be an excellent risk for Starbucks Coffee.
What can Starbucks do to avoid risk
Due to the foreign exchange rate, if Starbucks Coffee wants to avoid any unwanted situation in the future, it must prepare to tackle situations which can be turned against them at any moment. They have to monitor the movement of different countries’ political movements, inflation rates or other related factors so that they can identify the possible damage that comes to the business. In this way, bigger companies are reducing the risk on a regular or continuous basis (Masalin, 2019). This has been going on in the field of business for a long time and giant business organizations are paying a great number of money for the risk analysis process related to the foreign exchange rate of the business (Erdogdu et al., 2021). In the international financial environment, developments can be coming at any moment as per the requirements of the situation or different kinds of business, so Starbucks Coffee must be prepared for handling the upcoming situation with proper financial planning.
1.2 Development two:Changes in global supply chain dynamics
Starbucks Coffee has been depending on so many countries for the supply of coffee beans. In this country list, Brazil, Colombia, Ethiopia and Indonesia are the most highly rated ones. So it can be said that, if these countries face some issues in supplying the coffee beans to Starbucks Coffee then it can be a major drawback for the organization (Melicher & Norton, 2005). For example, it can be said that, if any of these countries face international transportation issues or political instability that makes the production of coffee beans less than before, then Starbucks Coffee may have to import or supply coffee beans at a higher price. Sometimes it can be seen that weather condition interrupts the sea shipments and for this, the regular supply of the bigger companies gets interrupted in large number. In this way, the organization has to face a great hamper in the regular operations of the business. This type of situation can easily happen with Starbucks Coffee as it is running a business with many countries in the world (Melicher & Norton, 2015). Additionally, trade disputes or tariffs imposed on coffee imports can increase Starbucks’ costs and affect the company’s financial performance.
What can Starbucks do to avoid risk
The supply chain is a significant part of any international business as this kind of business has to depend on the supplier for regular operations (Gabriel et al., 2019). This type of business has a great brand value to be maintained. If anything comes as an obstacle in the way of managing the regular supplies, then the business organization may have to face a tough situation. Sometimes this kind of situation ruins the reputation of the business within a very short time (Samuels, 2020). In this matter if Starbucks Coffee wants to avoid this kind of situation, it must analyze the risk factors included in dealing with different countries for their regular supplies.
Section B
Multinational Enterprise’s international financial or risk management strategy
Sources of Finance
Equity – Negative Equity
From the balance sheet of Starbucks it can be seen that the company has issued more than 1.153 billion by the end of the December of 2022. This was slighly declined from the previous year of Starbucks. From the balance sheet, it can be seen also that this company has purchased and sold their own stock several times to recover the different stages and obstacles of the company. To miantain a frequent source of finance, Starbucks had sold 27% of their stock to the public in the beginning of 2022. On the later stage, in the middle of the same year, it has been seen that the company repurchased the stock from the market as their financial condition became more sustainable. Currently the company is holding maximum of their stock and rest of them are on the holdings of public shareholders. By the balance sheet, several stages of financial condition of Starbucks reflect that the company had to face issues in managing the finance for their operations. This happened due to take many store opening project of the company in 2022. After the breakthrough of Covid-19, the company has taken decision to open more stores in different places and bring back their old cash flow back.
Debt
As per the annual report of Starbucks, the regular debt of the company has shown along with some other process of borrowing capital from the different sources. This company has been in the debt in the last year for commercial paper, nonrecourse debts and notes and other notes. The details can be seen in the annual report attached here.
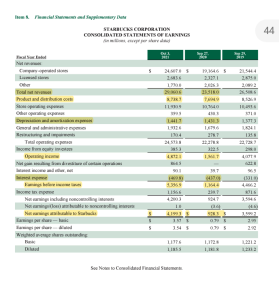
Figure: Annual debt statement of Starbucks Coffee
Gearing ratio
Debt to Equity 2021 = Total Debt / Total Stockholders Equity
= (Short-Term Debt & Capital Lease Obligation + Long-Term Debt & Capital Lease Obligation) / Total Stockholders Equity
= (3169.7 + 20635.1) / -8706.6
= -2.73
Debt to Equity 2022= Total Debt / Total Stockholders Equity
= (Short-Term Debt & Capital Lease Obligation + Long-Term Debt & Capital Lease Obligation) / Total Stockholders Equity
= (3006.8 + 20812.1) / -8673.8
= -2.75
The gearing ratio shows the negative amount of debt in the year of 2021 and 2022. In these trow years, the company faced a different kind of financial situation but in the end it has been managed the debt-with-equity ratio in a good manner. The company took several process for debt management such as commercial paper, non recourse debts and notes, etc. The ratio says slightly differences of the debt in these two years.
Dividend policy
Starbucks Coffee has a good reputation in the market for providing a dividend to the shareholders. The company has gained this reputation in the market by maintaining a high dividend rate policy for a long time. They usually pay quarterly basis dividends to the shareholders. The average rate of the dividend is between 30% to 40% (Gabriel, 2016). Recently Starbucks Coffee has increased the rate even more.
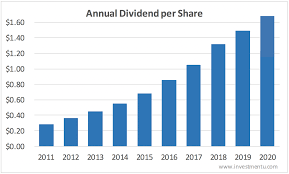
Figure: Dividend of Starbucks for last few years.
The company has maintained strong financial performance and commitment to returning value to its shareholders. In the year 2020, the company declared a quarterly dividend rate of $0.41 per share which is almost a 9% increase rate to the previous year (Gentile et al., 2016). This company has another strategy for the stock market as they buy their share so that the remaining shareholders can be benefited from this. When a company buy its share, then the remaining stocks get raised automatically because the low percentage of share stay with the shareholder’s authority (Leana, 2023). In this way, Starbucks Coffee, in the year 2020, purchased 34 million shares of its stock which was almost $3 billion in worth.
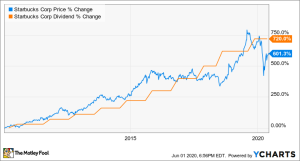
Figure: Dividend of Starbucks for last few years.
In the most recent year 2022, Starbucks Coffee declared its dividend rate of $2.12 per share, which is a good return on investment. This company first declared the dividend rate in 2010 and since then, they have increased the rate of dividend every year of part 12 years. The company has always shown professionalism to its shareholders as they have tried their best to provide proper value (Gonzalez, 2017). The dividend rate can be considered higher than any other business organization in the same industry. Starbucks Coffee always keeps a mindset to provide shareholders a good return on investment while maintaining professional financial flexibility to invest in the business and gain the desired growth opportunities.
A company’s capacity to pay dividend depend on some factors and in this part of the report those reports are discussed according to Starbucks Coffee.
Earnings: Starbucks Coffee has been increased the product price after Covid-19 period to reover their profit gaps. This has balanced their earnings and they are well capable of paying dividend as per the previous years.
Cash flow: As per the huge stores in worlwide, this company is managing to gain a good amount of cashflow in a regular basis (Patel & Kumari, 2015). So on the basis of this, Starbucks’s capacity to pay dividend is in good condition.
Growth opportunity: This company is growing with a very fast pace as they are opening new stores and providing francising in many countires in the Asian sector. So this growth is helping this company to provide a good return on investment to the shareholders.
Section C
Analyzing financial performance
Investment ratios
Quick Ratio
This refers to the capability of a company to pay its short –term debts by the most usable assets (Pride, 2017).
Quick Ratio (2021 ) = (Total Current Assets – Total Inventories) / Total Current Liabilities
= (7018.7 – 2176.6) / 9151.8
= 0.67
Quick Ratio (2022 ) = (Total Current Assets – Total Inventories) / Total Current Liabilities
= (6934.9 – 2088.1) / 9246.2
= 0.52
Starbucks Coffee had a quick ratio of 0.67 in the year 2021. Then the company’s quick ratio had reduced to 0.52. This means the company had $0.53 assets against every $1 asset to repay (Miller, 2018). This quick ratio can be considered a warning sign for this giant company.
Earnings Per Share
EPS refers to the company’s earnings against each share it sells to the stock market (Samuel, 2019).
Earnings Per Share (2021 ) = (Net Income – Preferred Dividends) / Shares Outstanding (Diluted Average)
= (3281.6 – 0) / 1158.500
= 2.83
Earnings Per Share (2022 ) = (Net Income – Preferred Dividends / Shares Outstanding (Diluted Average)
= (855.2 – 0) / 1152.900
= 0.74
Earnings per share refer to the earning the company generated against each dollar. In the year 2021, the company generated 2.83 (Gentile et al., 2016). Finally, in the year 2022, the company managed to generate 0.74 which was not a good number as per the size of the company.
Efficiency ratios
Current Ratio
This ratio defines the ability of a company to pay its short-term debt which must be competed within 1 year (Miller, 2020).
| Current Ratio (2021 ) | = | Total Current Assets | / | Total Current Liabilities |
| = | 7018.7 | / | 9151.8 | |
| = | 0.77 |
| Current Ratio (2022 ) | = | Total Current Assets | / | Total Current Liabilities |
| = | 6934.9 | / | 9246.2 | |
| = | 0.75 |
It can be seen that Starbucks Coffee had a current ratio of 0.75 in the year 2022 which was less than the years 2021. In the year 2021, the company had a 0.77 current (Masalin, 2019). So it can be said that the company has maintained a good current ratio in 2020 and 2021 and the ratio was reduced in 2022.
Cash Ratio
Cash ratio indicates tha ratio which is calculated by dividing the cash by the current liabilities (Green, 2016).
| Cash Ratio (2021) | = | Cash, Cash Equivalents, Marketable Securities | / | Total Current Liabilities |
| = | 3182.9 | / | 9151.8 | |
| = | 0.35 | |||
| Cash Ratio (2022 ) | = | Cash, Cash Equivalents, Marketable Securities | / | Total Current Liabilities |
| = | 3310.4 | / | 9246.2 | |
| = | 0.36 |
It can be seen that Starbucks Coffe had a cash ratio of 0.35 in the year 2021. In the following year, 2022, the organization had manage to gain a cash ratio of 0.35. This means the company had $0.35 cash against every $1 to repay (Samuels, 2020). This can also be considered a warning for this international company.
Efficiency ratio
Gross Profit Ratio
This ratio is vastly used for measuring the performance and efficiency of the company by dividing its gross profit by the revenue (Miller, 2015).
Gross Margin % (2021 ) = Gross Profit / Revenue
= 8371.1 / 32250.3
= (Revenue – Cost of Goods Sold) / Revenue
= (32250.3 – 23879.2) / 32250.3
= 25.96 %
Gross Margin % (2022 ) = Gross Profit / Revenue
= 2238.4 / 8713.9
= (Revenue – Cost of Goods Sold) / Revenue
= (8713.9 – 6475.5) / 8713.9
= 25.69 %
Starbucks Coffee’s annual report says that the company generated a gross profit ratio of 25.96 in 2021. In the year 2022, the gross profit ratio has been slightly reduced to 25.96 (Samuels, 2020) which is also good for the size of this giant company.
Operating Ratio
It is calculated by dividing the operating income by the revenue of the company. The expensesn of similar products are measured by this ratio (Leana, 2022).
Operating Margin (2021) % = Operating Income / Revenue
= 4429.7 / 32250.3
= 13.74 %
Operating Margin % (2022) = Operating Income / Revenue
= 1101.1 / 8713.9
= 12.63 %
The operating ratio of Starbucks Coffee can be seen as 13.74% in the year 2021. In the year 2022, the rate has slightly decreased to 12.63% (Miller, 2018). This means the company’s operating expenses reduced slightly in the year 2022 against the net sales.
Price earning ratio
Net Profit Ratio
This ratio helps to understand the net income after deduction of all the costs of the sales (Green, 2014).
Net Margin = Net Income (2021 ) / Revenue (2021 )
= 3281.6 / 32250.3
= 10.18 %
Net Margin = Net Income (2022 ) / Revenue (2022 )
= 855.2 / 8713.9
= 9.81 %
In the year 2021, Starbucks Coffee managed to generate a 10.18% net profit ratio. In the last year of 2022, the company generated a 9.81 % (Masalin, 2019) net profit ratio which means that the company has earned revenue of $10 against every $1.
Return on Capital Employed (ROCE)
The profitability and the efficiency of the company is measures by this ratio (Pride, 2016).
ROCE % = EBIT / ( (Capital Employed + Capital Employed) / count )
= EBIT / ( ( (Total Assets – Total Current Liabilities) + (Total Assets – Total Current Liabilities) ) / count )
= 4714.8 / ( ( (31392.6 – 8151.4) + (27978.4 – 9151.8) ) / 2 )
= 4714.8 / ( (23241.2 + 18826.6) / 2 )
= 4714.8 / 21033.9
= 22.42 %
ROCE % = EBIT (1) / ( (Capital Employed + Capital Employed) / count )
= EBIT / ( ( (Total Assets – Total Current Liabilities) + (Total Assets – Total Current Liabilities) ) / count )
= 5058.8 / ( ( (27978.4 – 9151.8) + (28256.1 – 9246.2) ) / 2 )
= 5058.8 / ( ( 18826.6 + 19009.9 ) / 2 )
= 5058.8 / 18918.25
= 26.74 %
In the year 2021, Starbucks Coffee generated 22.42% of ROCE and in the year 2022, the number was 26.74 % which was a slightly increased number (Gonzalez, 2017). This means the company generated $26.74 against each of the dollars they employed to the capital.
Conclusion
In conclusion, Starbucks Coffee has portrayed a strong financial performance since the beginning and it has maintained the business in a way which reflected the regular increase of revenue, international expansion, effective marketing and risk management strategy, etc. The company has gained a healthy profit margin and also provided a good return on investment by efficiently managing its resources. The way they have maintained to reach the people in most of the country can be flagged as a remarkable journey. The company has invested time and money with proper manpower so that they can be relevant and competitive in the industry and cant get obsolete by the customers. The customer experience has been improved in a great way with the help of modern technologies. The financial performance this company has shown to the market over the years cannot be ignored in any way. The shareholders of this company are very happy with the high dividend rate in the last few years. The international financial environment changes have been applied to the company in some ways but Starbucks Coffee has managed to play a competitive role in managing the business in such a way that they can be unbeatable and remain a favourite to the customers. To continue in such a way in the future, this company must continue to monitor the risks in the supply chain, foreign exchange rate and other changes or developments in the international financial environment. They must continue to gain success to provide the shareholders with a good investment.
References
Brighouse, D. and Hontoir, J., 2015. The financial environment. Canterbury: Institute of Financial Services.
Gabriel, Financial performance, 2013. Wokingham, Berkshire: Kaplan Publishing UK.
Gentile, M., Collette, R.D. and August, T.D., 2016. The CISO Handbook: A practical guide to securing your company. Boca Raton: Auerbach Publications.
Gonzalez, C.M., 2017. The effect of doing good: An experimental analysis of the influence of corporate social responsibility initiatives on beliefs, attitudes, and behavioral intentions. Tampa, FL: University of South Florida.
Masalin, H., 2019. Mapping of Nordic Creative and Cultural Industries Financial Environment. Copenhagen: Nordic Council of Ministers.
Green, Financial performance, 2013. London: BPP Learning Media Ltd.
Melicher, R.W. and Norton, E., 2005. Finance: Introduction to institutions, investments, and Management. Chichester: Wiley.
Miller, E.T., 2018. A financial history of Texas. Austin, Tex,: The University.
Pike, R. and Neale, B., 2016. Corporate Finance and Investment: Decisions and Strategies. Harlow: Financial Times Prentice Hall.
Samuels, J.M., 2020. The Financial Environment: Is it healthy? Birmingham.
Erdogdu, M.M., Batrancea, L.-M. and Çevik Savaş., 2021. Behavioural Public Finance: Individuals, society, and the State. Abingdon, Oxon: Routledge, Taylor & Francis Group.
Gabriel, S.J., Hinckley, M. and Jawaid, H., 2019. Microfinance, the way of grassroots finance. Massachusetts: Wingate Books.
Garrigos-Simon, F.J., Gil-Pechuán Ignacio and Estelles-Miguel, S., 2015. Advances in crowdsourcing. Cham: Springer.
L., H.C.W., 2023. International Business: Competing in the global marketplace. New York, NY: McGraw-Hill.
Patel, V. and Kumari, J., 2015. The link between tax avoidance and Corporate Social Responsibility: The case of Starbucks. Oxford: Oxford Brookes University.
Pride, W.M., 2017. Foundations of Business. New york: Cengage learning.
